Since 1999 the Honeybee and I have used our trusty Excel spreadsheet to steadfastly track how we use every dollar earned that is not siphoned off by federal and state taxes, or automatic retirement contributions. Over the years, this disciplined approach has given us extraordinary insight into our spending patterns which we use to continually optimize our personal finances.
Our household Constitution — I know, but just play along — requires the household CFO to deliver the annual family financial report every January to the household CEO. Yes, yes, that would be me.
Four weeks ago I specifically asked the household CFO to deliver her report to me by January 20th. Unfortunately, I regret to say that the Honeybee missed her deadline by a couple of days.
Ahem.
Naturally, her tardiness compelled me to assemble a crack committee — consisting of my kids Matthew and Nina — charged with investigating ways to prevent late reports from crossing my desk in the future. Hopefully, the kids’ report comes in soon, or else I’ll have to convene another committee to investigate methods for preventing tardy committee reports on, er, preventing tardy reports. But I digress.
Now I’ve never been a fan of tracking net worth, which is why I do this only once per year. Unless I plan on liquidating all my assets in the near future, net worth doesn’t really convey a lot of useful information.
That being said, the annual percentage change in net worth does give a fairly good indication of whether or not my personal finances are either improving or, perhaps, in need of some extra attention.
So, after reviewing the latest numbers, I am pleased to report that the state of the Penzo household is very good.
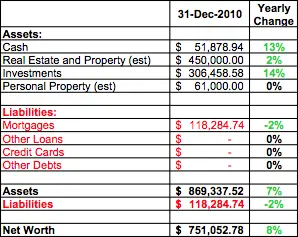
As of 31 December 2010 our household net worth was just a hair over $750,000. This represents an eight percent increase over 2009.
Overall, household assets increased seven percent while liabilities were reduced by two percent.
We continue to be financially disciplined. On the liabilities side, outside of our very small mortgage, we still have no loans, credit card debt or other obligations. That, ladies and gentlemen, is called financial freedom!
With respect to assets, I estimated no change in the value of our household personal property, which includes things like our two cars, furnishings, jewelry, and various collections.
Although home prices in my area essentially held their ground over the previous year, I estimated a slight increase in home value due to a kitchen remodel and upgrades to a bathroom and powder room.
Meanwhile, the value of my investment holdings (essentially my 401k account) increased approximately 14 percent this year.
My Long Term Financial Performance 1999-2010
Our household has relied on my engineer’s salary ever since Matthew was born 13 years ago. For that reason, we have always striven to stay out of debt, save as much as possible, and live well below our means.
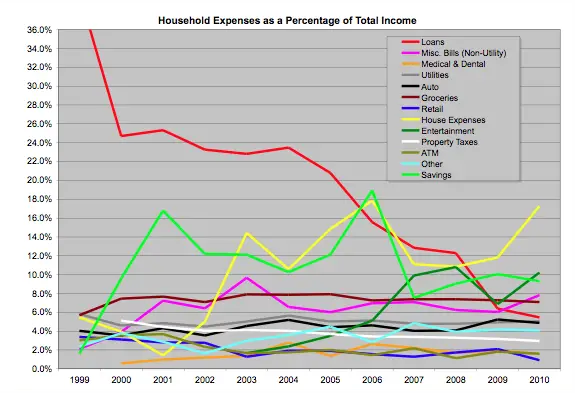
For those of you in your twenties and thirties, not to mention those who may be questioning whether early scrimping and saving is really worth all the hassle, just take at look at the next chart. It is a graphical representation of the Penzo family household expenditures between 1999 and 2010 as a percentage of my gross income.
Let’s analyze some key areas of this graph.
Worst Performance: 39.9% (!) of gross salary (1999)
Best Performance: 5.4% (2010)
Currently: 5.4%
Now, when looking at this summary chart of the household expenses over the past 12 years, the most glaring item is the red line on the chart. This is the percentage of my salary dedicated to loans and, as you can see, in 1999 it was literally off the chart. However, just look at how that red line plummets over time!
Key Takeaway: Patience is a virtue. Over time, people who choose to live within their means can expect to see less of their take-home pay consumed by loans.
Savings
Worst Performance: 1.6% (1999)
Best Performance: 18.9% (2006)
Currently: 9.3%
Cash savings extracted from my take home pay — but not including my 401(k) contributions — are represented by that lime green line.
Notice the impact that the loans had on our savings (not to mention all of the other expenses) in 1999. The irony, of course, is this is the very time when we were most vulnerable to defaulting on those pesky loans that were eating up most of my take-home pay! However, over time we were able to begin building a fairly significant savings cushion.
Key Takeaway: For those who can minimize their debt load, the ability to save increases over time.
Groceries
Worst Performance: 7.9% (2005)
Best Performance: 5.7% (1999)
Current Impact: 7.1%
Despite the fact that the brown line representing our food expenses looks essentially flat, it belies that our grocery bill has more than doubled in real dollars since 1999 — and I expect it will probably nearly double again over the next decade as Matthew continues through his teen years.
Key Takeaway: Paybacks are a bitch. Just as I ate my mom and dad out of house and home, Matthew is now doing the same to me.
Bonus Tip: Yes our grocery bill is large, but did you know our food bill would be as much as 20 times higher if my family of four ate most every meal at a restaurant? You can see the complete analysis here.
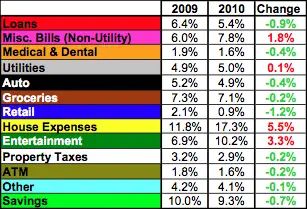
Finally, here is an illustrative breakdown of how we spent our money in 2010.
The chart to the right shows the changes where the household income was allocated over the previous year.
This year the biggest increases in expenses as a proportion of our household income were seen in the home expenses category. That is mainly because of our kitchen and bathroom upgrades. We spent more on entertainment too. Those increases, however, were offset by decreases in most every other category.
In Conclusion…
Believe me when I say that keeping detailed records not only instills an immediate sense of purpose toward improving your financial situation, but it also allows you to set smart goals.
I think the long-term data for our household reveals trends typical for households with a genuine commitment to living within their means. More importantly, it affirms the advantages and benefits of sticking to a disciplined budget that just can’t be seen over shorter periods of time — especially for those of you just starting out.
Now if you’ll excuse me, I’ve got to check on my kids. Their committee report was due over an hour ago.


My husband and I have done the same tracking for many years. It has helped us to make better spending/job choices. I would also like to tell you that I think that you are one of the most entertaining blogs I’ve ever read! I laugh out loud sometimes and my husband just raises one of his eyebrows at me… Keep up the good work!!
I do a similar thing. One small quibble is that “ATM” really isn’t a valid budget category. It’s money that is puled out and used for other stuff – entertainment, clothes, food, etc. You would have a more accurate picture if you allocated that to actual drivers for spending.
@Barbara: Aww, that’s very nice of you to say! Thank you.
@Diane: Yep. You’re 100% right about the ATM category. The thing is I don’t have the discipline to track my purchases with the cash I pull from our ATM! 🙂 When we were first starting out, almost all of our entertainment money came from cash we pulled from the ATM machine (in fact, we didn’t even have an “Entertainment” category the first few years). Frankly, I look at the ATM category as, more or less, a financial appendage now — kind of like my appendix or gall bladder. LOL
Wow, really cool tracking; way more than I’ve done with our finances. And the results look great!
Len, I would like to ask you what your net worth was 5 years into your spending/saving/investment plan.
I started being quite disciplined 5 years ago this coming July 1st.
I started out with a net worth of just over $100K in the hole. My net worth is now approximately $190K.
I hope that in 8 years, I will be in your position! I am doubtful though, because I got BURNED by my last employer in regards to my 401k and am very leary about that investment vehicle.
My last employer used the funds taken out of my paycheck (and everyone else’s also) and kept the money for themselves. They did not put it in the Prudential accounts like they were required to do by law. In my particular case, not one cent was ever deposited.
I have an open case with the Dept. of Labor (case is about 1.5 years old) and I am doubtful I will ever see the $600 per paycheck that I put into my 401k.
Therefore, I am stuck with maxing out my Roth privately (limited, of course, to $5K per year because of my age) and putting the rest into the stock market with regular mutual funds. This has the disadvantage of no tax breaks on my retirement funds – and keeps me at the 25% federal tax level. If I could trust the 401k as an investment vehicle, I could drop my federal taxes to a lower bracket.
@Darwin: We probably go overboard on tracking, but it’s great data to have on hand — especially after a few years and you can start seeing those trends.
@Spedie: Sorry to hear about your employer. I hope it all works out for you. As for my net worth 5 years in to this plan, believe it or not, we only started tracking net worth on the spreadsheet a couple years ago. If I had to take an educated guess, I suspect in 2004 it was probably about the same as it is now — maybe $100k less. My home was worth a lot more, but that was offset by less money in the 401(k) and definitely less cash on hand. Like I said though, I wouldn’t put too much stock in net worth, Spedie. 🙂
You know, I’m guessing the Honeybee probably spends on average a couple hours per month entering the data. I then generate the graphs from all the inputs.
Hey Len
The really cool thing about this is that you do not seem too obsessed with achieving that so called 7 figure net worth! I guess slow and steady wins the race.
@Dr. Dean: LOL! To tell you the truth, I am not even sure where my gall bladder is — I think it’s in my left arm, yes? Oh, and I’ll pass along your terrific ATM suggestion to the Honeybee. She’ll get a kick out of that!
@Mr.CC: Even as late as my early thirties, I admit I was obsessed with becoming a “paper millionaire.” I quit worrying about it though soon after when I realized that the only thing that really mattered was attaining financial freedom. Now, it doesn’t matter if my net worth is four, five, six or seven figures; it’s just a number. 🙂
Hi Len, I really enjoy snooping into your finances. Very instructive for all!!!! And of course, the beautiful graphs enchant me! Congrats on a good year. but please, don’t fire your wife 🙂
“Please don’t fire your wife.” LOL! My crack commission on tardiness said the same thing. 😉
Excellent detail. Love the graph where you look at things as a % of income. Nice way of doing it and I am going to start that myself.
Great Job, LP!
Though please don’t start with the appendix and gallbladder jokes, that is my territory.
Though really I am more comfortable with uterus, and ovary jokes-I will have to try to remember one…
And maybe just label your ATM category as “Honeybee Date Money” (it will look good even if not true!)
Hi!
This is great! I would love to start tracking expenses like you do!
I’m only Excel-lite. Would you be willing to share a template of the spreadsheet you use?
Thanks!
Jeremy
Wow. I’m drooling with spreadsheet envy. It’s not the numbers on your page that I admire (although those are also nice), its your system. Dang and double-dang. You’ve got a better tracking system than most companies.
Spreadsheet envy. heh. That’s a good one, Paula. It’s nice to be on the other side of the “envy” equation for once in my life… 😉