 As the old saying goes, knowledge is power.
When it comes to tracking personal finances, one of the most important pieces of information in you can have in your knowledge database is a detailed summary that highlights where your household income was spent during the previous year. Such a summary not only provides extraordinary insight into your spending patterns, but it also helps you optimize your personal finances.
I’ve been using an Excel spreadsheet since 1999 to steadfastly track how my household has spent every earned dollar that wasn’t used to pay federal and state taxes, or contribute to my 401(k) retirement fund. I know. Yes, it may be a bit obsessive, but hopefully, by sharing some of these details with you, I can motivate a few of you to do start keeping more detailed records of your own.
I only check my net worth once per year. That’s because I find net worth to be an irrelevant statistic unless I plan on liquidating all my assets in the near future, which I don’t.
That being said, the annual percentage change in net worth does give a fairly good indication of whether or not my personal finances are either improving or, perhaps, in need of some extra attention.
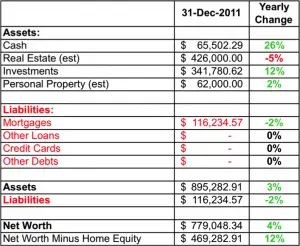
As of 31 December 2011 our household net worth was approximately $779,000. That’s a four percent increase over 2010.
When it comes to net worth, I also like to track it sans my home equity because I need a place to live and don’t plan on selling it anyway. Somewhat ironically, that number increased 12 percent this year, helped along by the falling value of my home.
Overall, household assets increased three percent while liabilities fell two percent.
So, after reviewing the latest numbers, I am pleased to report that the state of the Penzo household remains extremely favorable.
We continue to be financially disciplined. On the liabilities side, outside of our very small mortgage, we still have no loans, credit card debt or other obligations. As a result, I am essentially enjoying a life of financial freedom.
My Long Term Financial Performance 1999-2011
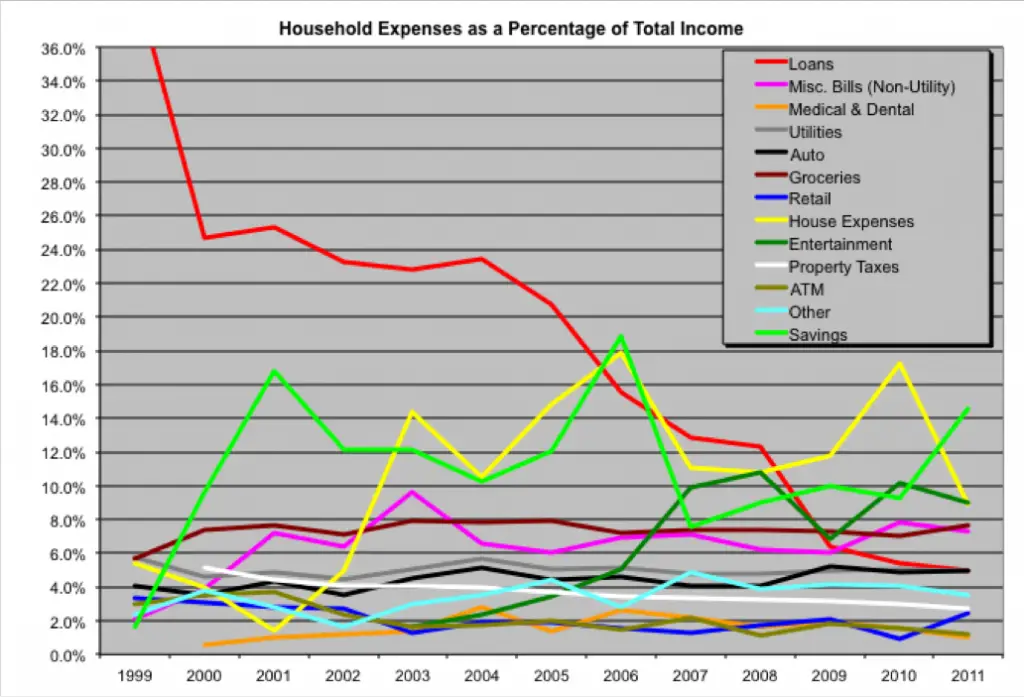
I love the next chart. It’s a graphical representation of the Penzo family household expenditures between 1999 and 2011 as a percentage of my gross income. It also happens to provide an especially important financial lesson for twentysomethings: Although being fiscally disciplined is tougher early on when income is tighter, it eventually does lead to the promised land of financial freedom — perhaps even quicker than you might think. To prove it, let’s focus on my my loan obligations and savings.
Worst Performance: 39.9% of gross salary (1999)
Best Performance: 5.0% (2011)
Currently: 5.0%
The degree of financial freedom I enjoy increases every time that red line falls toward the bottom of the graph. That’s because it shows the percentage of my salary obligated to paying off debt. At one time, two out of every five bucks I earned went to my creditors. Today, it’s barely 1 out of every 20. Hopefully, that falling red line will inspire folks who are making big sacrifices now building their retirement funds and emergency savings to stay the course. I also hope it motivates others to get off the debt treadmill.
Key Takeaway: The best method for keeping that red line on a steady, if not steep, downward trajectory is to continually grow your income and minimize your debt.
Savings
Worst Performance: 1.6% (1999)
Best Performance: 18.9% (2006)
Currently: 14.6%
Cash savings extracted from my take home pay — but not including my 401(k) contributions — are represented by that lime green line. Due to the extremely tough business climate where I work, we purposely saved a larger portion of my income in order to avoid financial Armageddon and increase our household cash reserves in the event of a layoff. Thankfully, I managed to stay gainfully employed all year long.
Key Takeaway: Smaller debt loads provide greater flexibility to financially cope with an economic hardship — whether it’s anticipated or not.
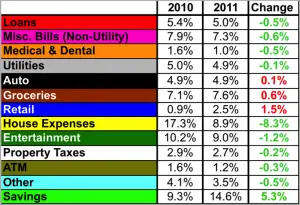
Finally, here is an illustrative breakdown of how we spent our money last year.
The chart to the right shows the changes where the household income was allocated over the previous year.
This year the biggest impact of redirecting a greater portion of my income to savings was fell on our home expenses; we had to cancel plans to remodel our master bathroom.
Despite my rising income, we spent more to maintain our two aging automobiles. Despite my family’s love of leftovers, our grocery bill also increased, which is undoubtedly attributable to the increasing appetites of my 12- and 14-year-old kids. However, I also believe the increase is a legitimate sign of increasing inflation.
Thankfully, we managed to spend less in almost every other category last year.
In Conclusion…
By doggedly tracking household spending data through the years, I’ve been able to better manage my household expenses. I think my data clearly reveal positive trends that are typical for households with a genuine commitment to living within their means. It also proves how sticking to a disciplined budget can lead you to a better life in the long run.
Knowledge is power. For most people, it’s a critical component to achieving financial freedom.
Photo Credit: Jan Tik


Good stuff. That’s a lot of lines on that Excel sheet! For all the tracking I’ve done with mine over the years, charts is one thing I’ve never added. I’ve considered it but have never gotten there. I track mine by month. I like to see the slow progress as well as to see how we are coming on the goals I set at the beginning of each year.
Oh, we track our expenses by month too. To simplify things I am only showing a very top level overview of my data — so I only posted graphs based on yearly totals. Otherwise, those graph lines would be too jagged to read.
Take advantage of those charts. I do! I’ve got pie charts, bar charts, all kinds. I know. I’m sick.
Len, I haven’t updated my Net Worth in 3 years (I used to do it around my birthday in November). I’m eeling like quite a slacker this morning seeing your post – using Mint (with its Net Worth estimate) has been my undoing, haha.
I wanted to give you a thumbs up and I’m glad that you proved the apocalypse won’t come until at least 2013!
Thanks, Paul. To be honest, when it comes to my job, the apocalypse is always a potential 90-day notice away. 😉
Great job Len.
I used to track my net worth and investments meticulously. But, I’m now at the point where I know where I stand off the top of my head. So, I don’t have to spend as much time entering it into Excel.
I’m probably there too, Bret. But the engineer in me won’t let me stop tracking the data. LOL
this is another area where wise use of credit cards benefits a person. a lot of them will provide most of this information for you thus eliminating doing it yourself on excel.
True, a good chunk of this data was taken from our credit card statements. However, what the credit card company won’t do is provide me with access to the information in a fashion that allows me to easily manipulate it six ways to Sunday. And believe me, what you see is just the tip of the iceberg. For that, I do need a spreadsheet tool like Excel.
Is there a way that you could provide us with a spreadsheet that you use? (obviously a sanitized version that doesn’t include your data).
You got it, John.
I know I’m late to this party, Len, but I’d also love a sanitized version of your spreadsheet if you’re willing to share. I apologize if I missed on this page — looked all over but not finding it. Great article. So needed in the world of debt we live in these days. Thanks!
Hi, I too would love a cleansed version but cant find it anywhere? can you send me a copy as well?
Hey Len,
Looks like your investment portfolio did quite well. Anything special in there? Or does that include hefty additional deposits?
Unfortunately, that didn’t represent the total return on my investment, JT. It included my deposits too.
My actual ROI was in the neighborhood of 4.5 percent. The Dow finished 2011 up 5.5 percent, so I underperformed compared to that. Although, admittedly, I kept most of my 401(k) contributions — and almost all of my 401(k) balance — out of the stock market this past year. Still, it’s better than a loss!
How do you classify things like shampoo or disinfectant? As groceries or other?
That falls under the “retail” category, Shannon – since we usually buy that stuff at Target or some place similar.
Wow, never seen this before Len. Very brave! Would feel a bit like going into the sea for a swim naked, or more importantly perhaps coming out. 😉
Congrats on your progress.